ESRI Course: Getting Started With ArcGIS Pro
Northridge Earthquake Visualization
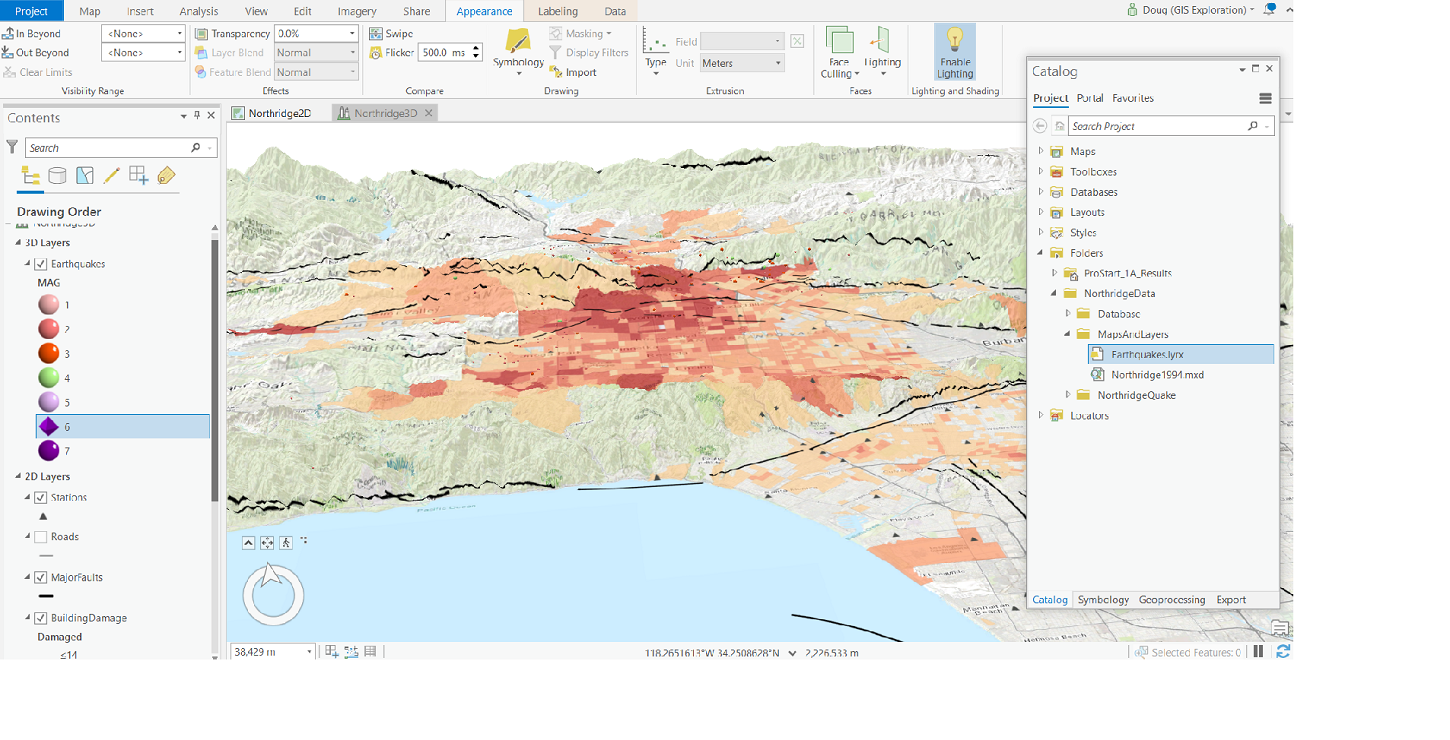
The screenshot below is a 3D map of building damage in the San Fernando Valley due to the earthquake, with faults, seismograph stations, and a basemap. The analysis is conducted in Pro. Elevation of the surrounding mountains shows up nicely.
I am not sure why the earthquake epicenter symbols (spheres shown in the Contents pane, except magnitude 6 which is a diamond) are not showing. That layer, which is highlighted
in the Catalog pane, was provided by ESRI in the dataset to start the exercise.

I completed ESRI's Spatial Data Science: The New Frontier in Analytics, using Pro, and got this certificate

More screenshots of my spatial data projects, and more on Pro to come as I continue learning how to use it!