Geology Experience
Well-site Geology
Mud Logs
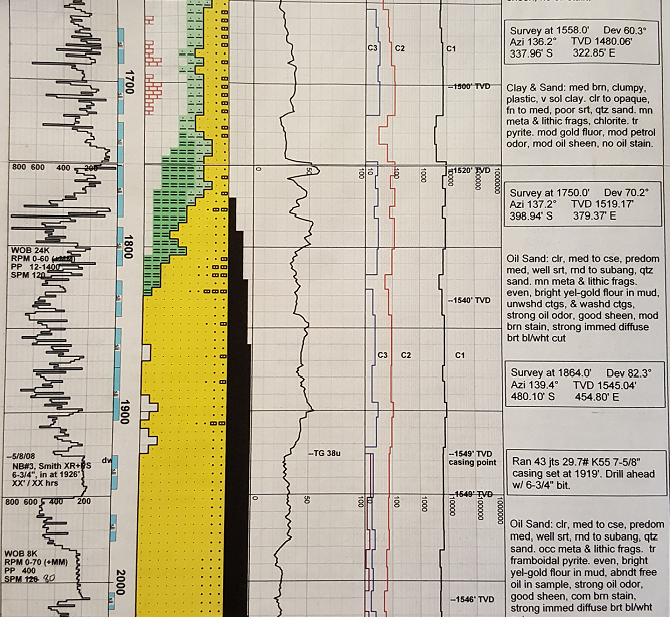
Below is a mud log I made in California as a well site geologist. It is composed of data I gathered by sampling the cuttings from the borehole every 30 feet and monitoring the gas content and drilling rate, or rate of penetration (ROP). It displays an oil show. At 1750' we see ROP, in the left column, increase along with the gas content in the well, shown in the middle column. Twenty feet later we see sand (yellow blocks) start to drastically increase when the oil, shown in black bloks, starts to appear in the sample. At the same time, sandstone goes away, especially below 1800', leaving the layer with more unconsolidated, porous material. Oddly there was no increase in ROP or total gas or methane content, as seen in the gas curves in the middle and middle-right columns. The lithology descriptions in the right column explain the evidence for the oil in the samples. I saw some evidence for oil starting at 1770'. Between 1650' and 1770' I elected to not call it a show because the samples did not feature a blueish-white cut with the lighter fluid test and also found no yellow-gold flourescence in U-V light.
